Section 1.3: Debugging Assembly (pt 1) & Making the Files
Why Debug Assembly?
Unlike many other programming languages, assembly allows for much more control over lower level software/hardware. We will be making changes that are much harder to track mentally. Debugging allows us to see the memory itself, registers, etc. Some debugging tools even allow us to modify said registers and memory values.
We will be using the GNU Project Debugger or GDB for short while in Linux. GDB is a command line debugger which provides a large set of features:
- Natively supports Python scripting
- Supports a large number of architectures (and even quite a few languages)
- Provides a Text User Interface (TUI) mode
How to Debug using Assembly
Preconfiguration
When launching GDB, you may notice your interface does not look like mine. This is because I use a configuration file that adds customization to my interface. Lucky for you, we provided you with a preconfiguration file. The gdbinit providese a way to run a number of setup commands at launch. You will just need to copy the config file to your home directory:
cp ~/path/to/repo/handouts/sample-gdbinit ~/.gdbinit
The instructions above will copy the sample gdbinit to your home directory as a hidden file (as directed by the . in front of the name) and will rename it to gdbinit
Make the Files
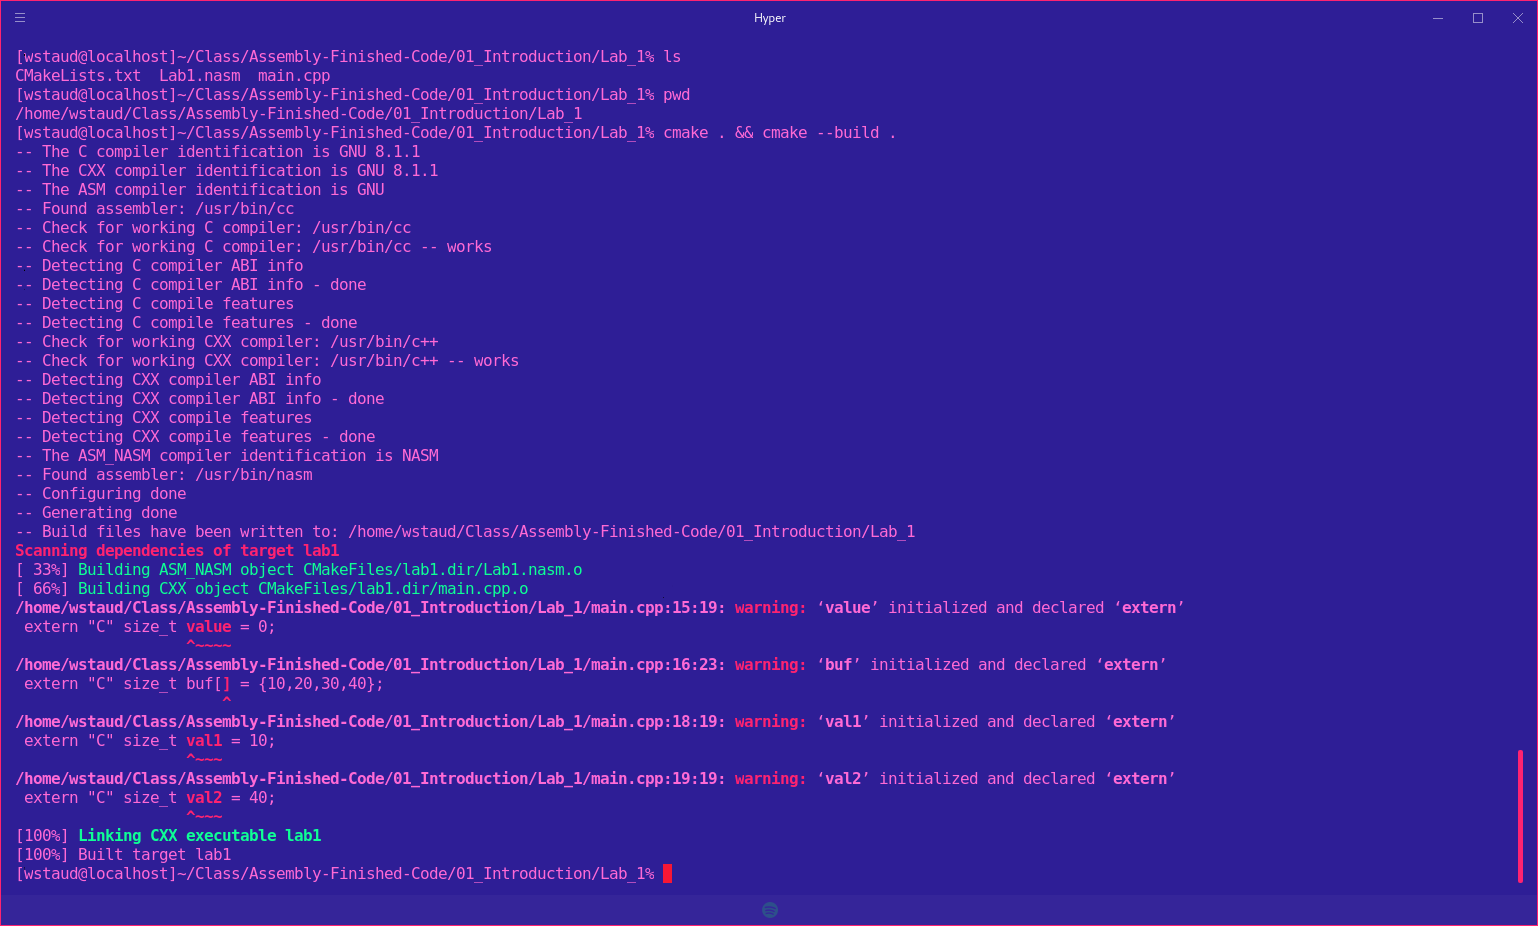 After you have written your code, you will need to cd to the path and run a series of commands to make the files.
Change Dirs to proper lab:
cd ~/path/to/lab1/
Make the files (DO NOT FORGET THE PERIODS!):
cmake . && cmake --build .
There is a file in the lab directory called CMakeLists.txt. This file instructs/configures a program build tool called CMAKE to build the nasm and cpp file and output an executable. If you peek inside of the cpp file, you will notice a couple of things. First, we "extern" some functions. This allows us to create a link of sort between the nasm and cpp file. We then later call  the extern'd function in main (or some other function) as if it were a regular function. If you don't understand how the
  C/C++ compiler and linker work, feel free to ask for a refresher and I will provide one given we have time.
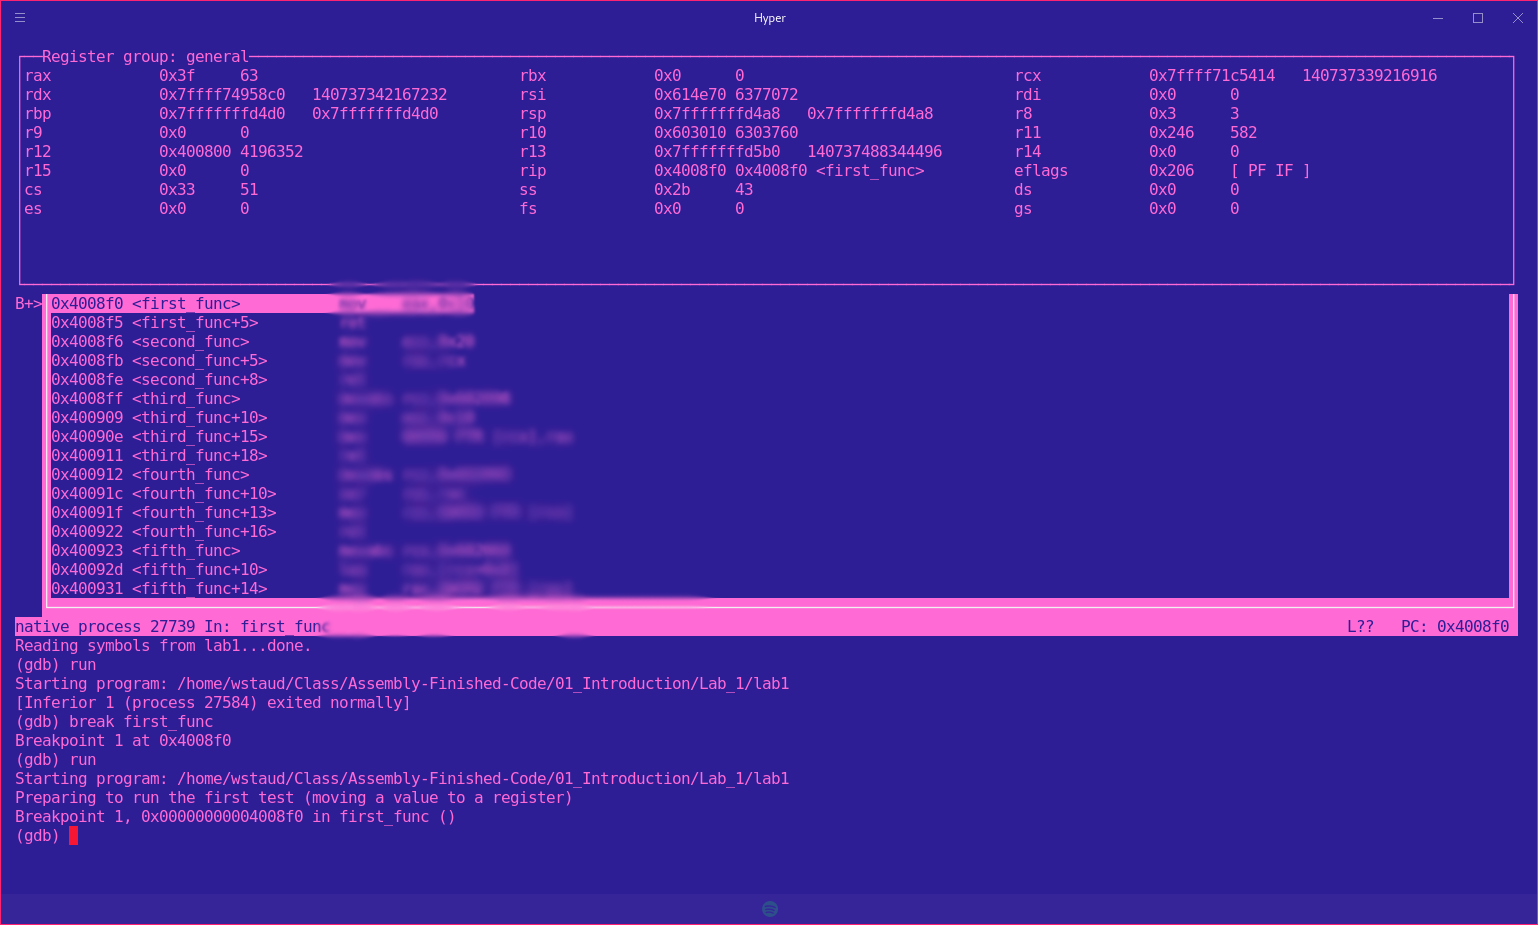
Launching an Executable with GDB
- CD to directory containing lab
- run: gdb labx (x being the lab number)
- In the GDB window, type "run" to execute the program. The program will run all the way through because there are no break points.
- In the GDB window, type "quit" to quit GDB. You will be returned to the standard terminal.
$ cd ~/path/to/lab1
$ gdb lab1

(gdb) run
...
(gdb) quit
Basic Usage
- info (command) : displays information (in general, or about a specific command)
- help (command) : can provide context-specific help; t.g., listing avaliable commands/options
- refresh : will redraw the console window (very important)
Breakpoints (break)
Using breakpoints allows us to programmatically set breakpoints without modifying application source code. We can set breakpoints on memory addresses, symbols (such as funciton names), etc.
- break (location) : will create a breakpoint at the location.
- info break : shows us information about all currently set breakpoints
- clear or delete : Allows us to remove breakpoints
Example:
(gdb) break myfunc
Breakpoint 1 at 0x4004a4
Num     Type       Disp     Enb     Addreses
1       Breakpoint  keep    y       0x00000000004004a4
(gdb) delete 1
(deb info break)
No breakpoints or watchpoints
Setting breakpoints programmatically as shown above, may sometimes be difficult. A good strategy may include applying breakpoints directly in your code for debugging purposes. Fortunately, an assembly instruction exists for doing just this!
int3; NOTE: no space between int and 3
Which translates to the opcode:
0xcc
By placing the above in your code, the debugger will be interrupted on run and will automatically wait for the user to continue the program or start stepping before continuing.
Instructions
- step/s : Single stepping (can also use stepi)
- next/n : Stepping Over (can also use nexti)
- continue : continue normal execution (you can also create another breakpoint and continue to it)
- finish : Continue until the current function returns
Additonal Resources
Lab1
Proceed to the Lab1 directory and follow instructions